## THE PAGE IS CONSTANTLY UPGRADED AS THE PROJECT IS BEING UNDERTAKEN AND SCHEDULED FOR PEER REVIEW PROCESS
THE BASICS

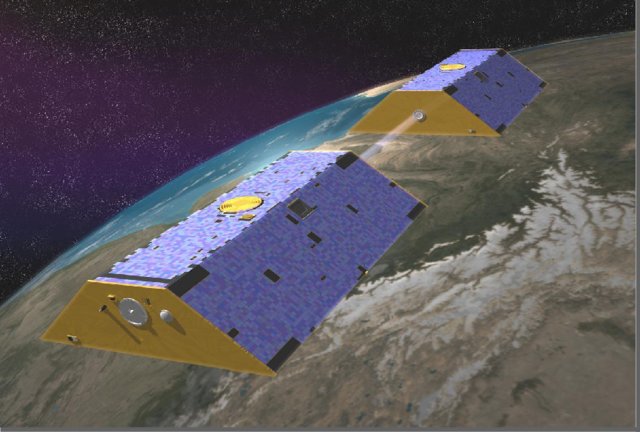
Figure 1. Thats where the data comes from , GRACE twin satellite with a separation of 200 km at an elevation of 500 km. Source: [NASA](https://earthobservatory.nasa.gov/features/GRACE)

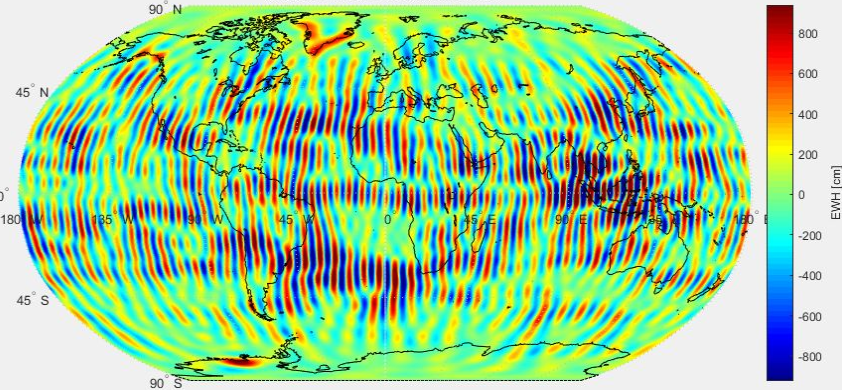
Figure 2. This is how the data for Water Storage Changes look like as per the initial anlalysis. Alas, we cannot derive anything useful from the data yet.

Figure 2. This is how the data for Water Storage Changes look like after Data Processing, which includes doamin specific knowledge, data cleaning approach and extensive harmonic analysis. Alas, Simialr maps are used to derive Water Stotrage Changes.

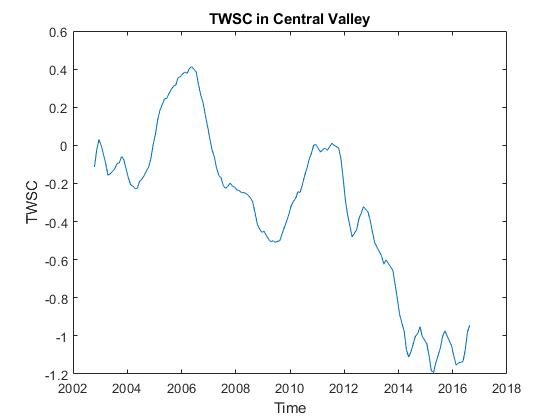
Figure 4. Time Series of variations of the Total Water Storage Changes (TWSC) after processing of the noisy GRACE meaurements. TWSC provides important info about the Surface, Soil, Atmospheric and Groundwater Storage Changes on Earth

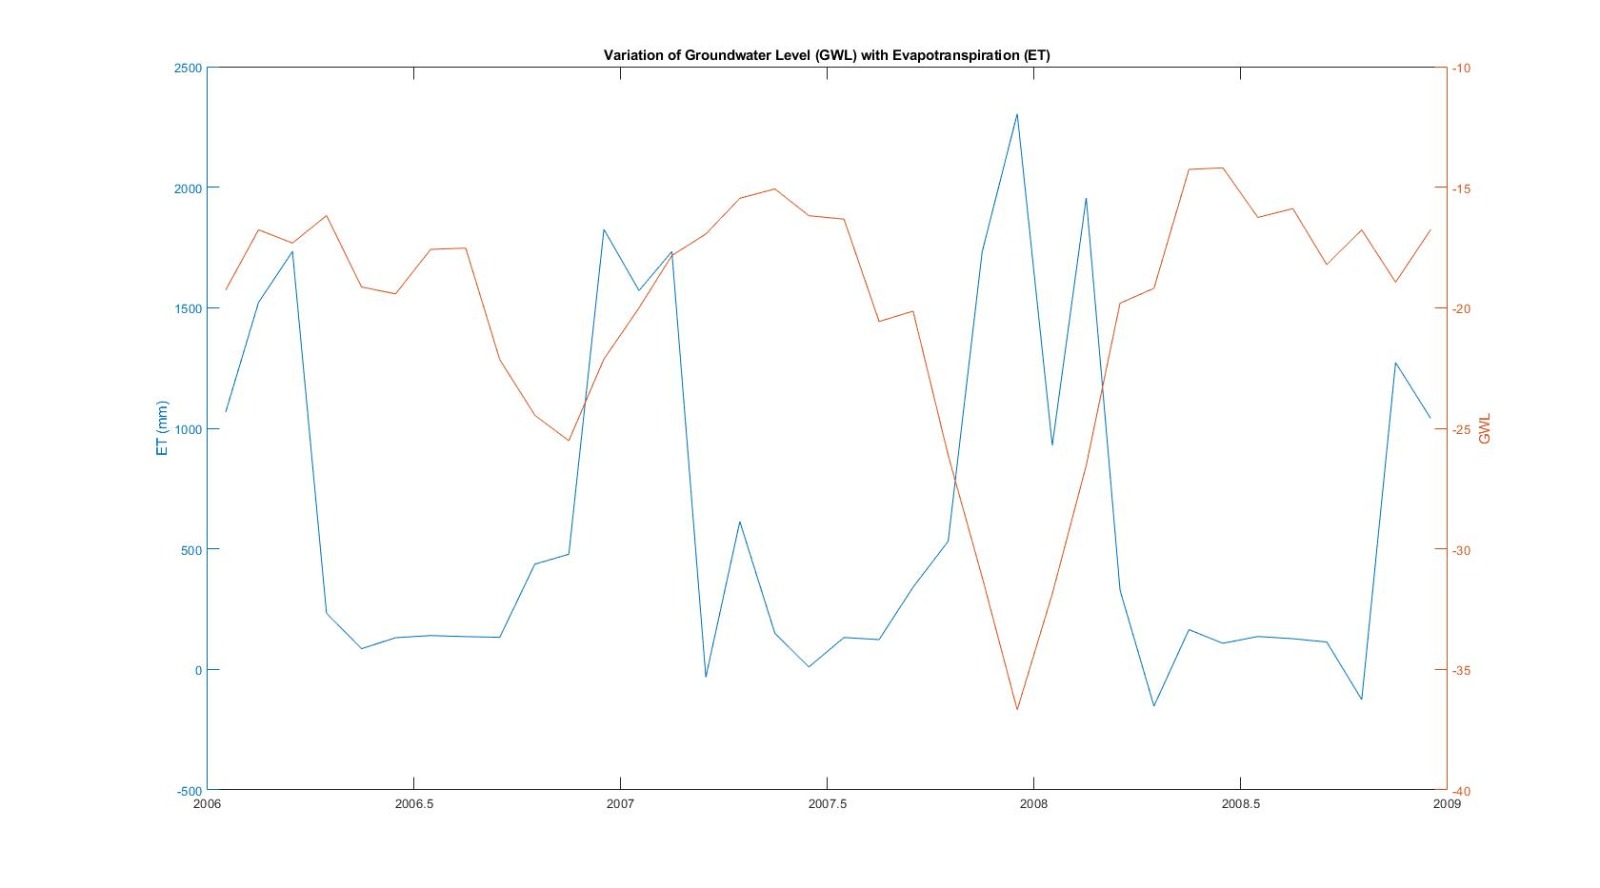
Figure 5. The analysis of the dependence between variables